Service Visibility: See Your Runtime Before You Ship
Ordo Platform's service visibility feature lets you check the health, version, latency metrics, and rule sync status of every registered engine — so you can confirm your runtime is ready before a rule goes live.
The Blind Spot in Rule Deployment
The riskiest part of shipping a rule change is usually not the rule itself — it’s not knowing which engine version it will land on, or whether that engine is healthy right now.
Tests pass in dev. Staging looks fine. But in production, one engine instance is still running the previous ruleset because its NATS connection dropped three minutes ago. You don’t find out until the alert fires.
Ordo’s service visibility feature closes that gap.
What You Can See
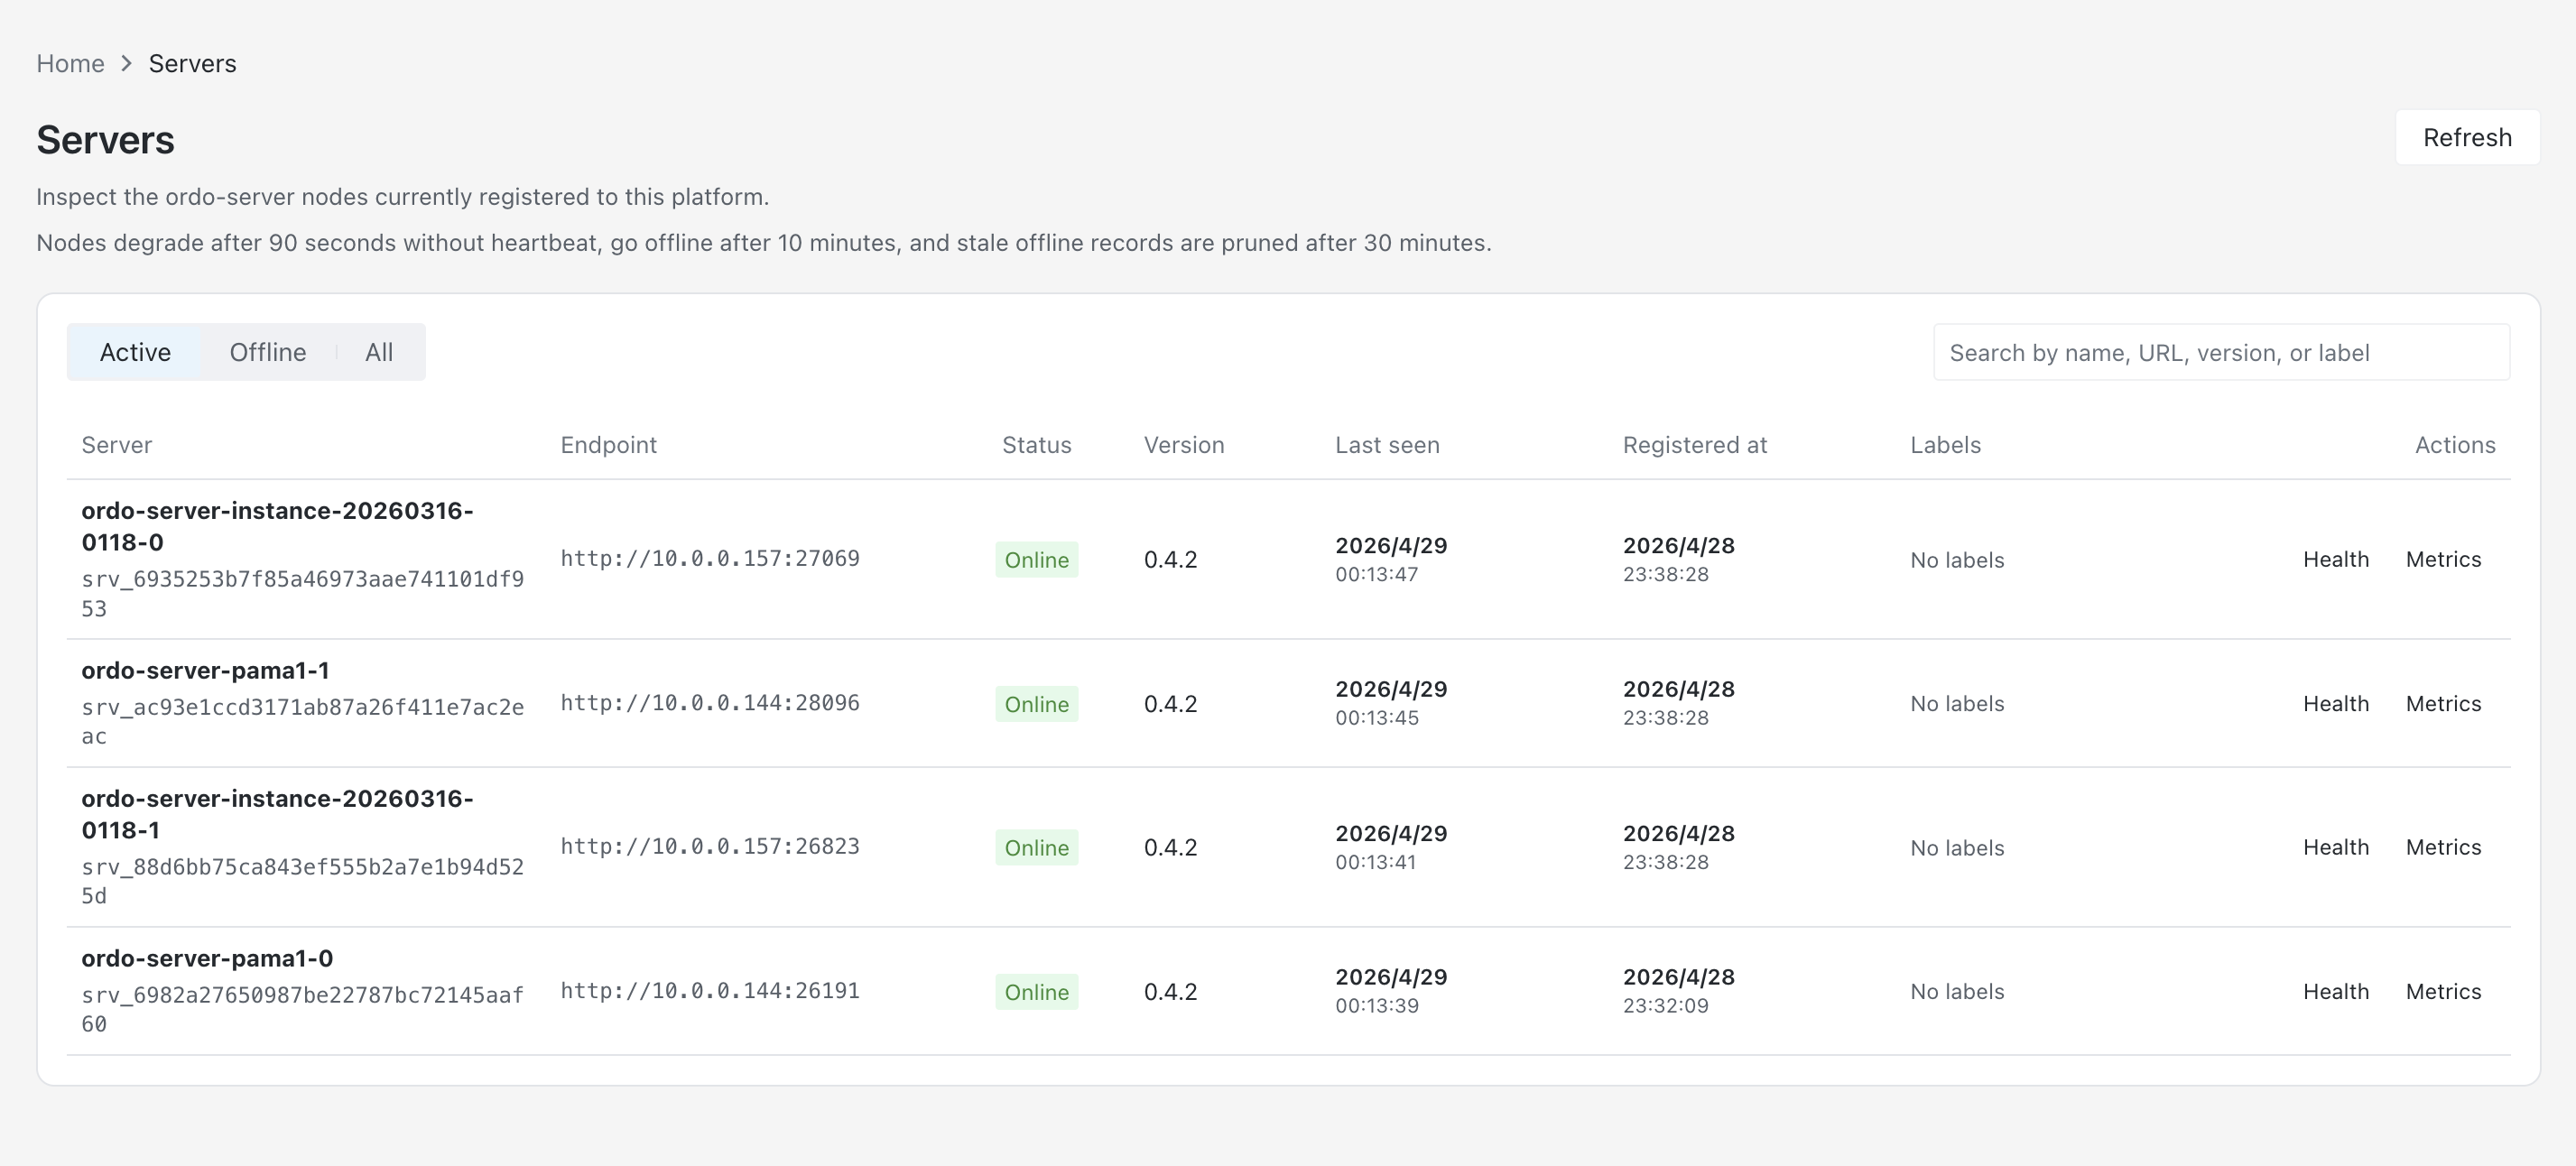
In the Engines section of the Platform dashboard, every registered ordo-server instance is listed with:
Identity
- Instance name and registered address (
ORDO_SERVER_URL) - Registration time and last heartbeat timestamp
Health Status
healthy/degraded/unreachable- Heartbeat latency (milliseconds)
- Full output of the most recent health check
Rule Sync Status
- Currently loaded ruleset hash
- Version delta from Platform’s latest (how many versions behind)
- Timestamp of the last successful sync
Performance Metrics
- QPS over the last 5 minutes
- P50 / P95 / P99 execution latency
- Memory and goroutine usage overview
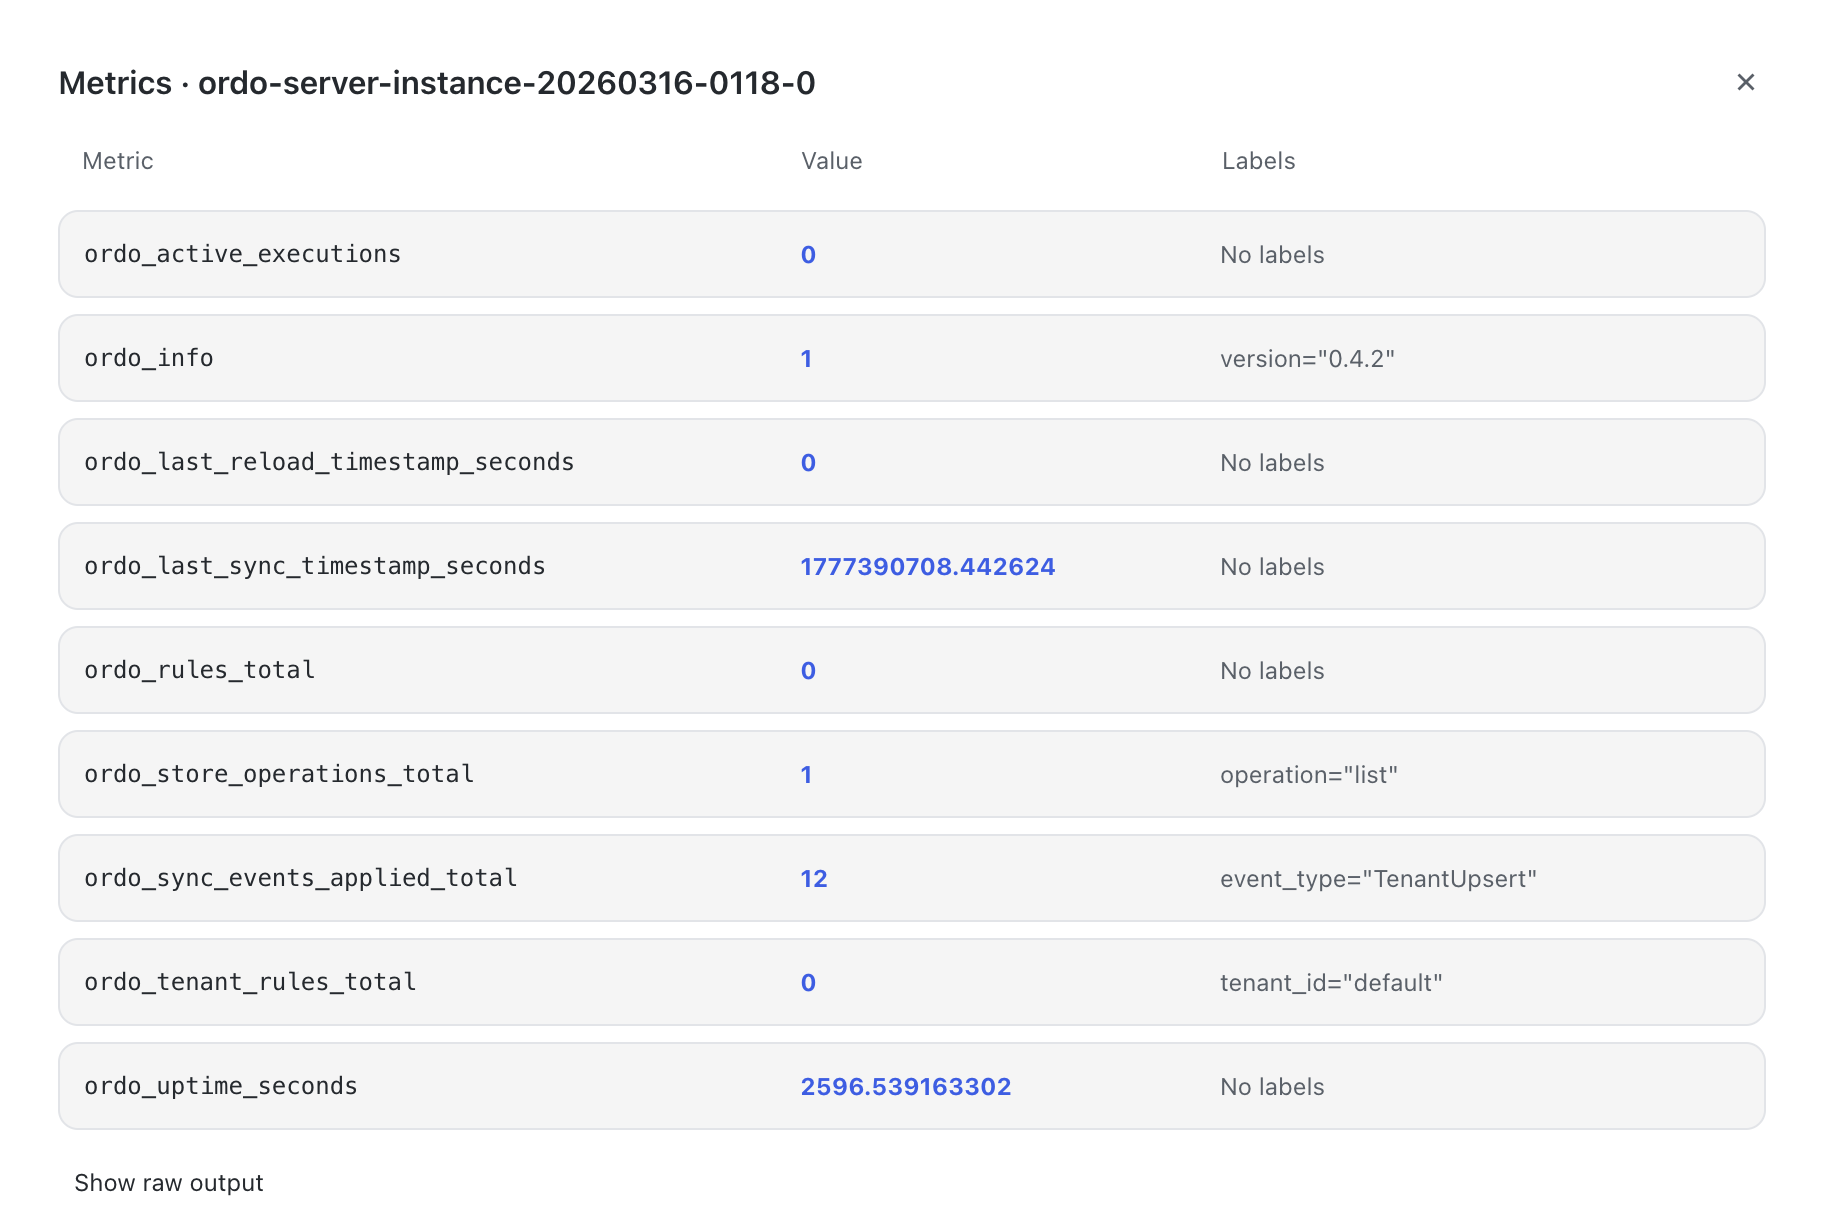
Click the Metrics button on any instance to inspect its Prometheus metrics directly:
How It Works
Engine registration and heartbeating are the foundation of how Platform tracks engine state.
When ordo-server starts, it sends a registration request to ORDO_PLATFORM_URL with its address, name, and version. From there, it sends a heartbeat every 10 seconds. Platform tracks the last-seen timestamp for each instance and derives health status from it.
Rule sync happens over NATS JetStream. When Platform publishes a rule change, it publishes to the ordo.rules.* subject. Subscribed engine instances receive the message, hot-reload the ruleset, and report the new rule hash on their next heartbeat.
This means Platform can precisely answer:
- Which instances have the latest rules loaded
- Which are still on an older version (NATS interruption, delayed restart)
- Which have gone silent entirely
Pre-Deployment Checklist
Before publishing a rule change, confirm:
- All target instances are healthy — publishing with a degraded instance means that node will keep running the old rules for an unknown duration
- Versions are consistent — if some instances are one version behind, you’ll have split behavior during the rollout window
- Heartbeat latency is normal — elevated latency usually signals network instability or instance load spikes
The Platform publish dialog integrates this check. If any target instance is unhealthy, you’ll see an explicit warning before confirming — and you’ll need to acknowledge it to proceed.
Multi-Tenant Isolation
In a multi-tenant deployment, rule publications are scoped to the publishing tenant’s engine instances. The service visibility page filters by tenant by default. Admin users get a global view across all tenants.
Getting Started
Log in to Ordo Platform and navigate to Infrastructure → Engines. If the list is empty, ordo-server hasn’t registered yet — check that ORDO_PLATFORM_URL and ORDO_SERVER_TOKEN are set correctly in your engine configuration.
File issues at GitHub or read the deployment docs.